Brain Geek: Adventures in Academia
Sunday, September 18, 2011
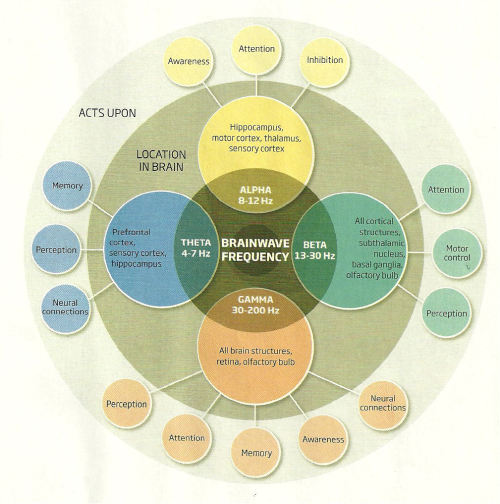
It seems so simple when you put it in a chart
from
I Love Charts
No comments:
Post a Comment
Newer Post
Older Post
Home
Subscribe to:
Post Comments (Atom)
No comments:
Post a Comment